The Tangle: an Illustrated Introduction
Part 1
This is the first in a series of beginner-level posts aimed at those who want to learn more about how IOTA works under the hood. We will loosely follow the whitepaper, but go a bit slower and add some pictures to clarify the basic concepts. In this part, we introduce the Tangle, explain what it is, and how we study it mathematically in the IOTA research team.
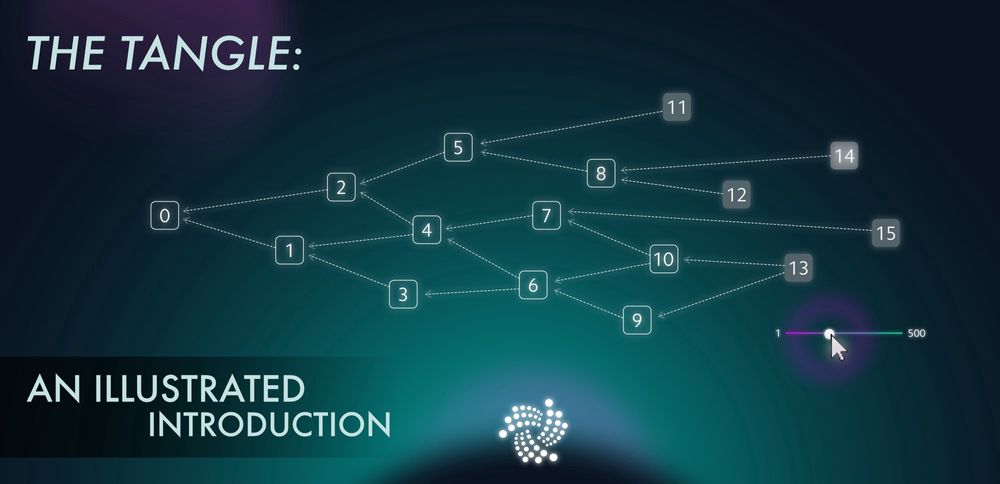
To understand the Tangle, we need to learn about what computer scientists call a directed graph. A directed graph is a collection of vertices (squares), which are connected to each other by edges (arrows). This is an example of a directed graph:

The Tangle, which is the data structure behind IOTA, is a particular kind of directed graph, which holds transactions. Each transaction is represented as a vertex in the graph. When a new transaction joins the Tangle, it chooses two previous transactions to approve, adding two new edges to the graph. In the example above, transaction number 5 approves transactions number 2 and 3. Transactions are more or less what you would expect, information in the form of “person A gave 10 IOTAs to person B”. At this stage, we won’t worry too much about what we mean by approving a transaction, as we’ll get into that later.
We call unapproved transactions tips. In the example above, transaction number 6 is a tip because no one approved it yet. Each incoming transaction needs to choose two tips to approve (there is always at least one!). The strategy for choosing which two tips to approve is very important and is the key to IOTA’s unique technology. However, to make our lives easier, we’ll start with the simplest strategy: choosing randomly between all available tips. Each incoming transaction looks at all the currently unapproved transactions and simply chooses two at random.
To show you what the Tangle looks like when everyone uses this random selection strategy (technically called “uniform random tip selection”), we’ve made a visual simulation of it. This simulation generates random Tangles, with the very first transaction (called the genesis) on the left and the most recent transactions on the right. The tips are marked with a gray square. When you put your mouse over a transaction, all the transactions approved by it are highlighted in red, and all those which approve it turn blue.
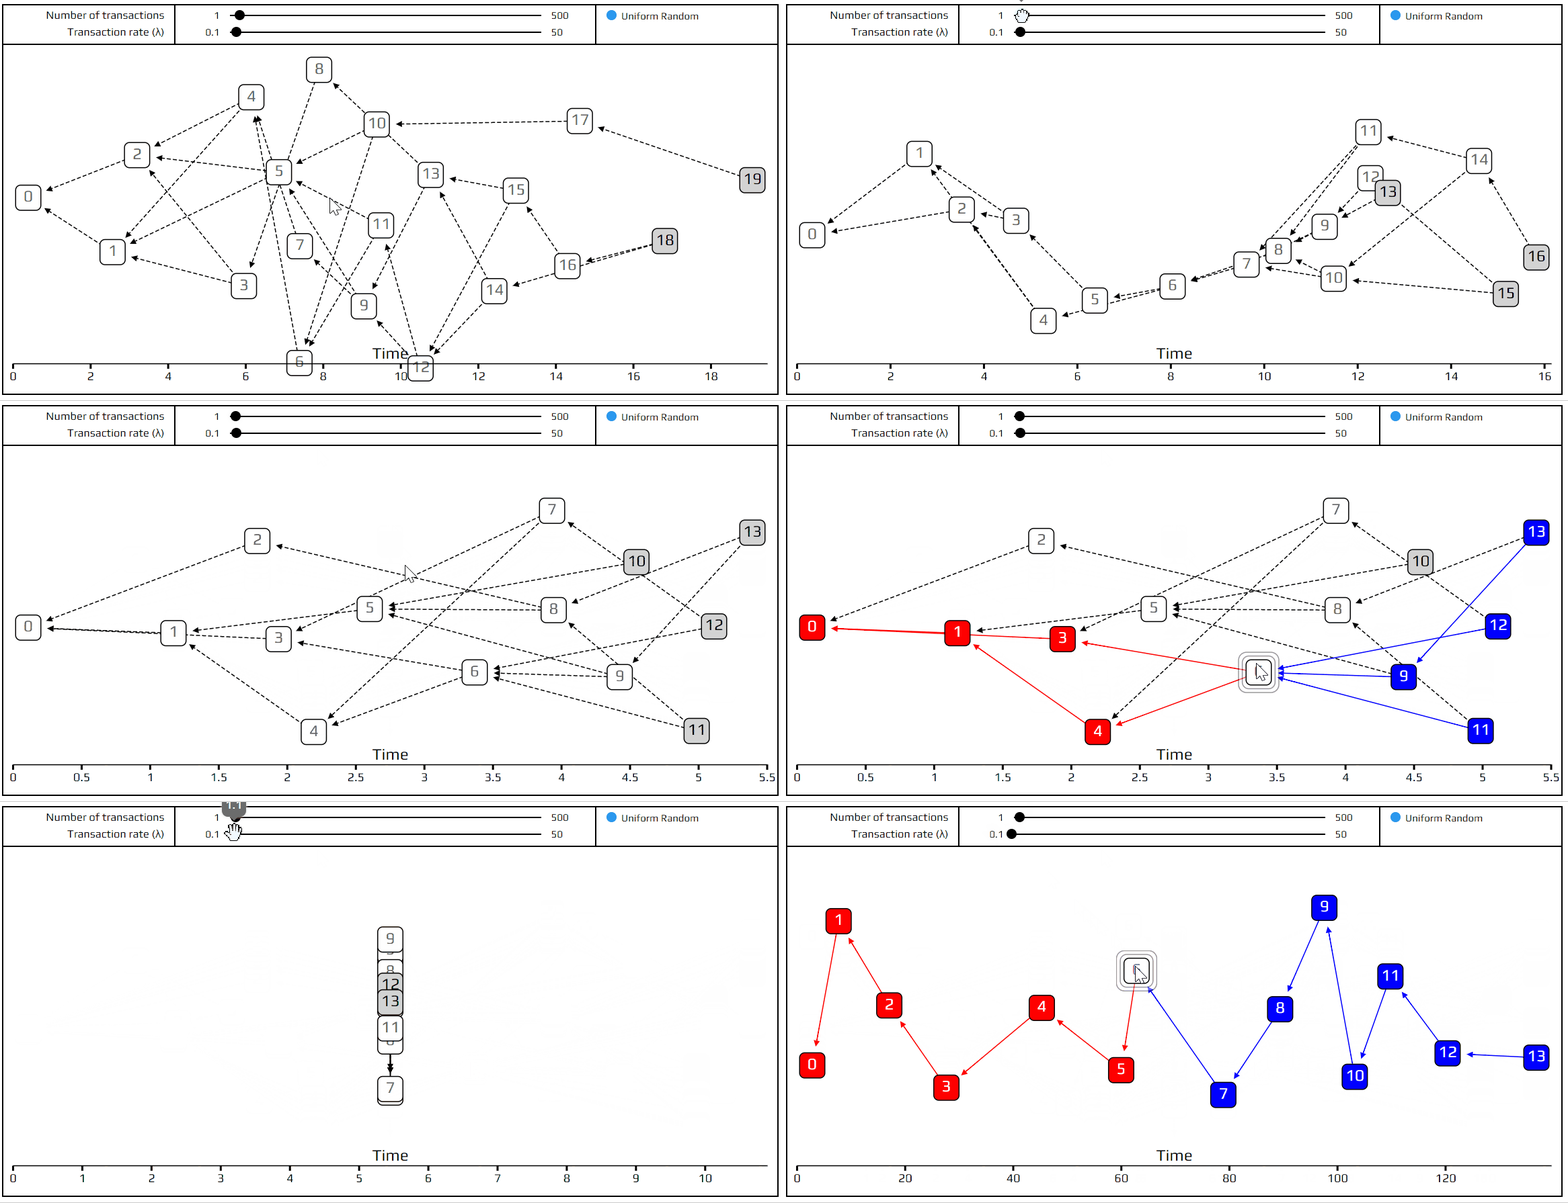
That’s it for today! We invite you to play with the simulation, try out different configurations, and ask questions here or on our#tanglemath Discord channel. In the next article, we’ll explain what we mean by the transaction rate(λ), introduce more advanced concepts such as indirect approvers and hidden tips, and learn about a more sophisticated tip selection strategy: the unweighted random walk.
Part 2: transaction rates, latency, and random walks
Part 3: Cumulative weights and weighted random walks
Part 4: Approvers, balances, and double-spends
Part 5: Consensus, confirmation confidence, and the coordinator
Follow us on our official channels for the latest updates
Discord | Twitter | LinkedIn | Instagram | YouTube

